Purity is the first number most people look at on a peptide report. It is also the number people misread most often.
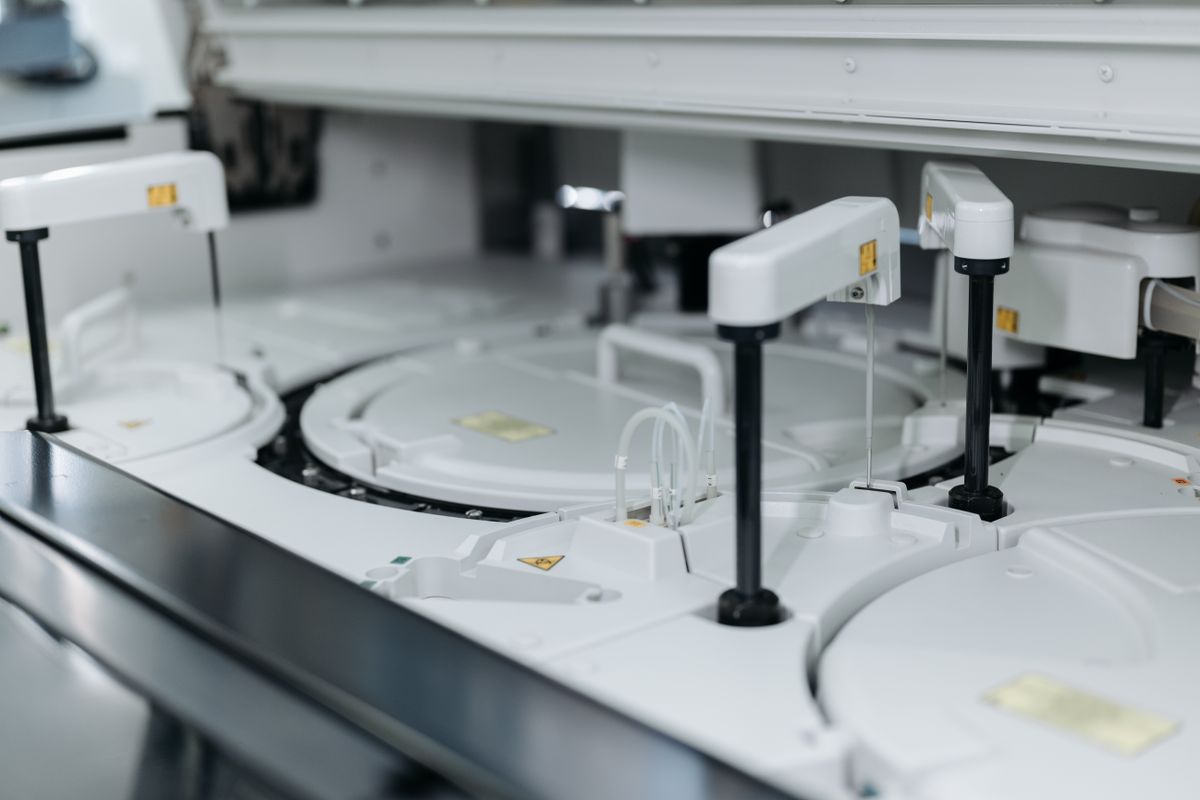
Here is how a lab gets it. The sample goes into a machine called an HPLC, short for high-performance liquid chromatography. The machine pushes the sample through a tube packed with tiny beads. Different substances travel through the beads at different speeds, so they come out one after another instead of all at once. A sensor at the far end records each one as a bump on a chart. Those bumps are called peaks.
The lab then measures the area inside each peak. It divides the biggest peak by the area of all the peaks added together. That fraction is the purity number.
Read that description again, because every step in it puts a limit on what the number can mean.
Beyond the peak
The number is a comparison, not a count. It compares the main peak to the other peaks the sensor happened to see. It does not compare the peptide to everything in the bottle.
Here is the precise version. A report of 99% purity says that 99% of the light absorbed at one wavelength, usually 214 nanometres, came from the main peptide chain. It is a measure of the substances that absorb that light, relative to each other. It is not a measure of mass.
Two assumptions are hidden inside that comparison. Both are often wrong.
Assumption one: everything shows up equally. It does not. The sensor shines one exact kind of light through the liquid and measures how much gets absorbed. Most labs use light at 214 nanometres, which the backbone shared by all peptides absorbs. Some use 280 nanometres, which only two building blocks absorb. If a stray fragment is missing those two building blocks, it barely registers. Its peak looks tiny. The amount of it is not tiny.
Assumption two: everything comes out separately. Sometimes two substances come out at the same moment. When that happens the machine draws one peak instead of two, and the stray material gets counted as part of the main peak. The strays most likely to hide there are the ones shaped most like the real thing. That means a copy missing one link, or a mirror image of the correct molecule.
The purity number tells you how the sample spread out inside the machine. It does not tell you what the sample is.
What HPLC misses entirely
Some material passes through the machine without leaving a mark at all. The part of a molecule that absorbs the light is called a chromophore. Anything without one is invisible to this test, however much of it is in the bottle.
Three groups matter:
- Counterions and salts. Purification leaves a partner ion bound to the peptide, most often trifluoroacetate (TFA) or acetate. At the wavelengths labs actually use, these barely register, and often register not at all.
- Leftover solvents. Manufacturing leaves traces behind — water, acetonitrile, DMF and other reagents. On the chart, every one of them is a blank.
- Impurities with no chromophore. Heavy metals and inorganic salts travel through the machine without ever being seen.
None of these appear as a peak. None of them lower the purity number. All of them are still in the vial.
What is actually in the vial
That is why purity and quantity are two different questions. A freeze-dried peptide is usually 70 to 85 percent peptide by weight. A typical vial supplied as a TFA salt breaks down roughly like this:
Treat those figures as an illustration rather than a standard. The split shifts with the peptide and with how it was finished. The shape is the point. A vial can read 99 percent pure on the chart. It can still hold about a quarter less peptide than the label weight suggests.
Two more things the number leaves out
- What the substance actually is. One clean peak arriving at the expected time fits the peptide you ordered. It also fits any other substance that travels at the same speed. Arrival time is a clue, not proof.
- Anything that never came out. Very sticky material can stay stuck in the tube for the whole run. Whatever stays inside is never measured.
The verification gap
None of this makes HPLC a weak test. It makes it one test, answering one question. Closing the rest of the gap takes methods that work on different physics. Mass spectrometry (MS) confirms identity. Karl Fischer titration measures water. Elemental or amino acid analysis (AAA) measures how much peptide is really there.
That second run is the cheapest check on the list, and the one most often skipped. Change the beads in the tube, or change how acidic the liquid is, and everything comes out in a new order. If the main peak stays single both times, that is strong evidence the sample really is one substance. One high number from one run is not.
Six questions worth asking
A purity figure with no method attached cannot be judged yet. These six questions turn it into something you can weigh:
- What kind of light was used, and how long did the run last?
- Is this plain area percent, or has it been corrected for how much peptide is in the powder?
- Does the report give the counterion content and the water content as separate numbers?
- Was the identity confirmed by weighing the molecule, and was that done on this batch or an older one?
- Is there a second run, set up a different way?
- Can you see the actual chart, or only the final number?
A supplier who can answer all six is describing a real process. A supplier who gives you a number and nothing else is describing a number and nothing else.
Scope note
This article explains published research and the rules around it. It carries no dose,
no protocol, and no claim that any compound treats, cures or prevents a condition in
anyone. Where the evidence is thin we say so. See our
editorial standards.
Correction · 20 August 2026
Version 1 said a freeze-dried peptide is usually 80 to 90 percent peptide by weight. The published range is wider than that, so the text now says 70 to 85 percent. Thanks to the reader who sent us the handbook reference.
References
- United States Pharmacopeia. General Chapter <621>, Chromatography.
- United States Pharmacopeia. General Chapter <1052>, Biotechnology-derived Articles — Amino Acid Analysis.
- United States Pharmacopeia. General Chapter <921>, Water Determination.
- European Pharmacopoeia. General Chapter 2.2.29, Liquid Chromatography.
- ICH Harmonised Tripartite Guideline Q6A, Specifications: Test Procedures and Acceptance Criteria for New Drug Substances and New Drug Products: Chemical Substances.
- ICH Harmonised Tripartite Guideline Q3C, Impurities: Guideline for Residual Solvents.
- Merrifield, R. B. Solid Phase Peptide Synthesis. I. The Synthesis of a Tetrapeptide. J. Am. Chem. Soc. 85, 2149–2154 (1963).